
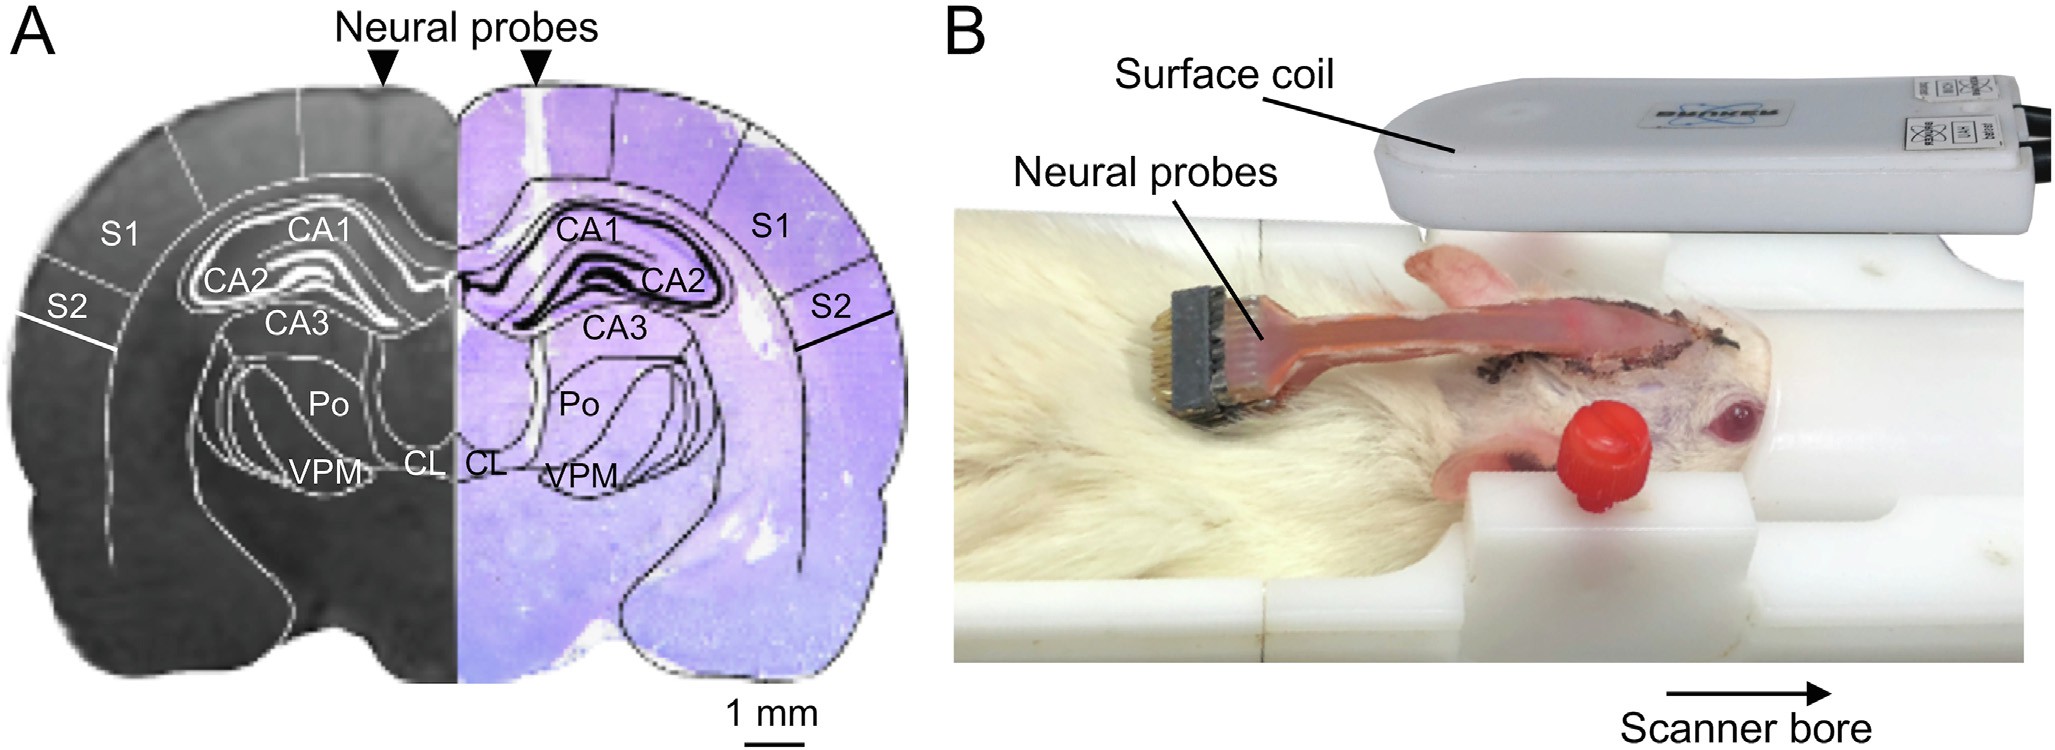
Fig1. Localization of neural probes and experimental setup for animal MRI measurement.
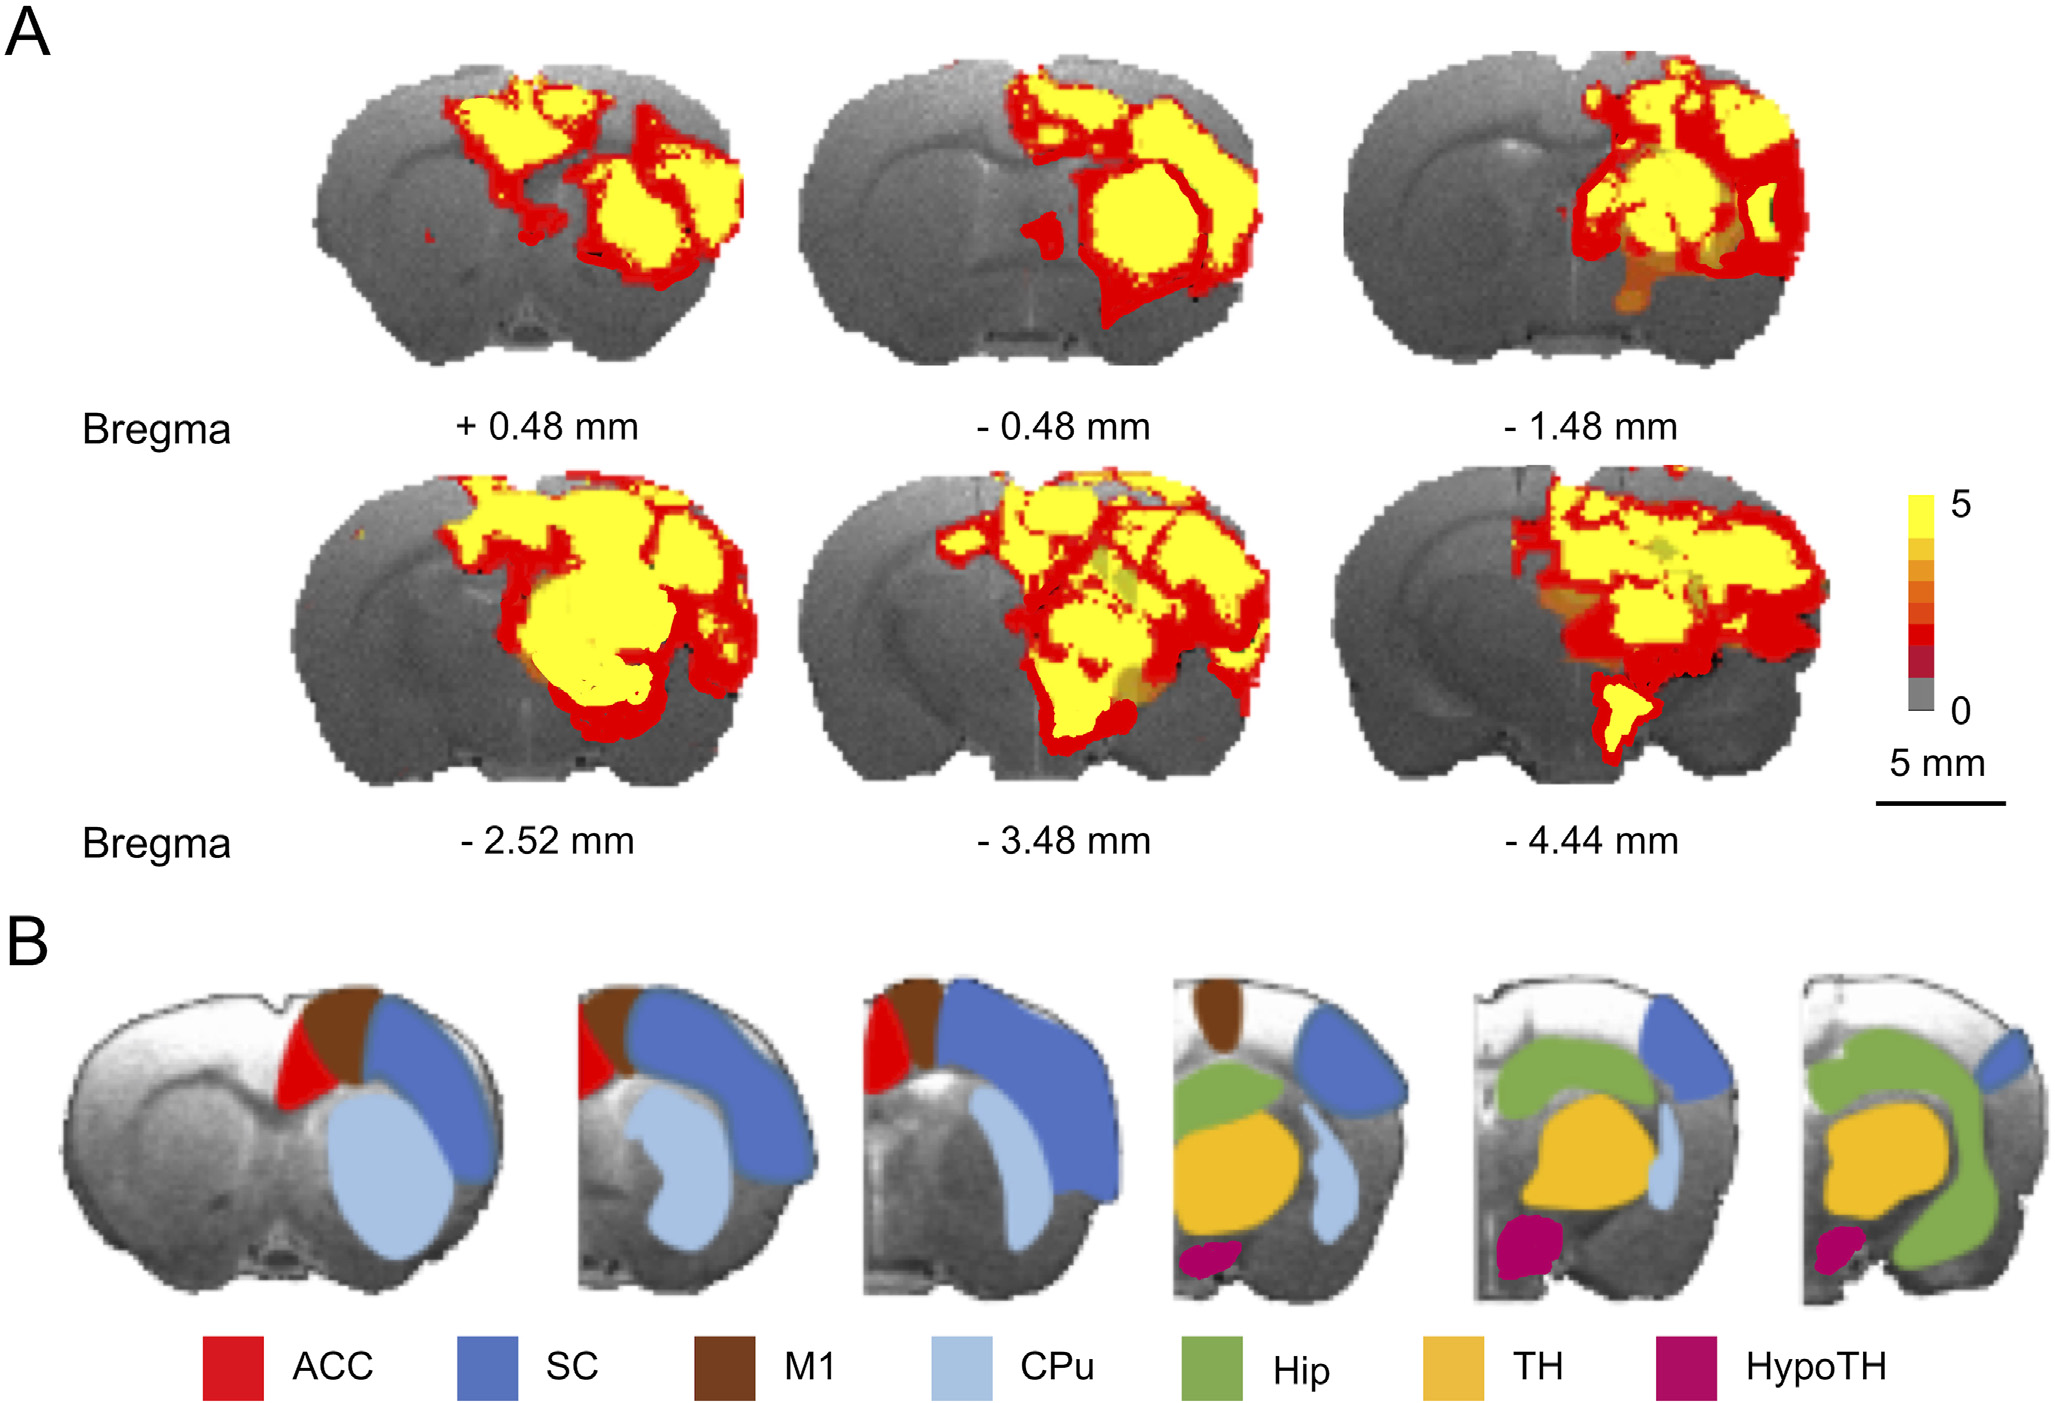
Fig2. Activation maps of CT-DBS and ROIs representation on atlas.
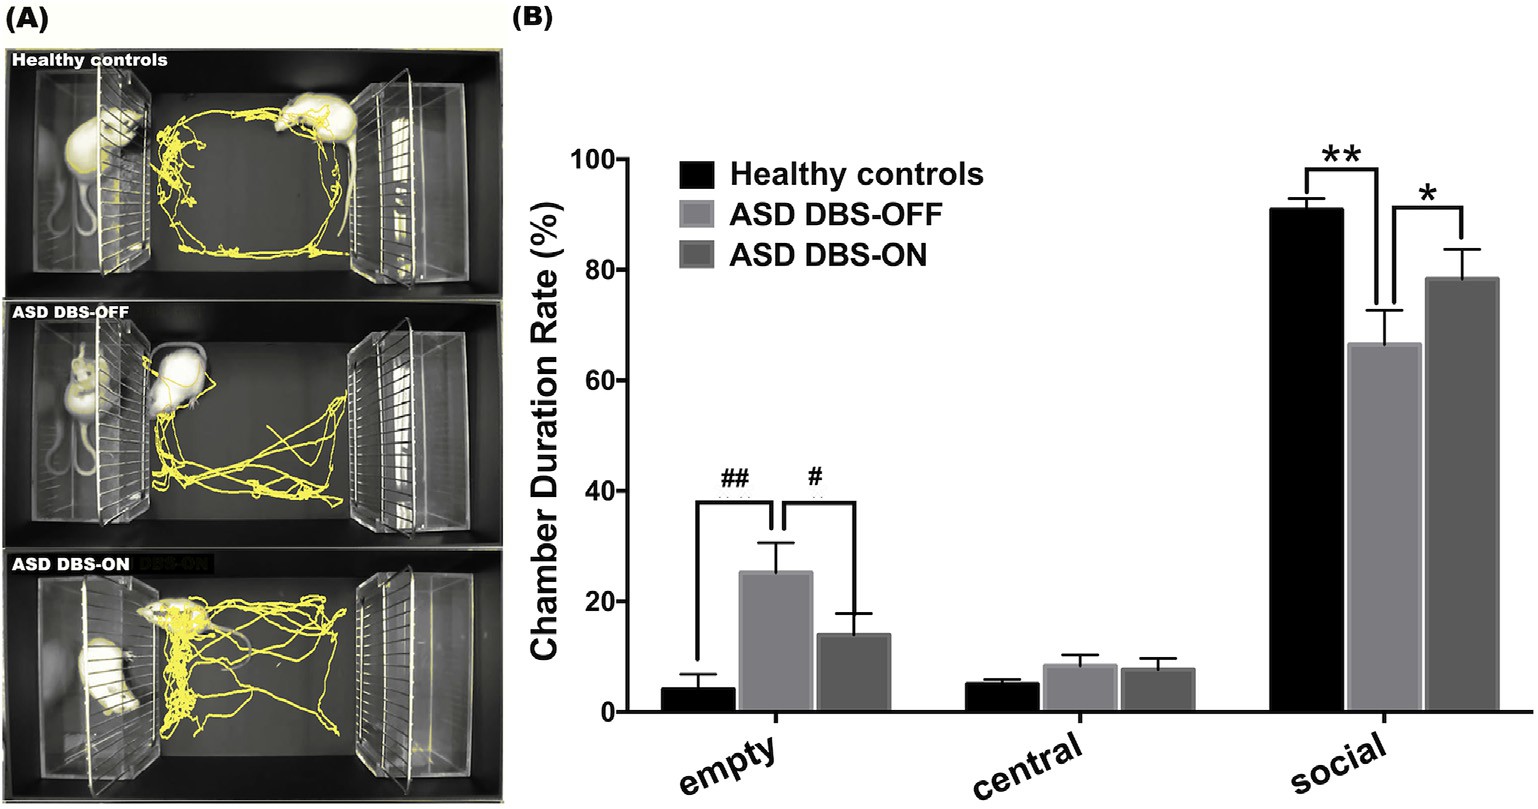
Fig3. (A) Overview of the three-chamber social test. Tracking trajectories are denoted by yellow lines. (B) Chamber duration rate among the healthy controls, the ASD DBS-OFF group, and the ASD DBS-ON group.
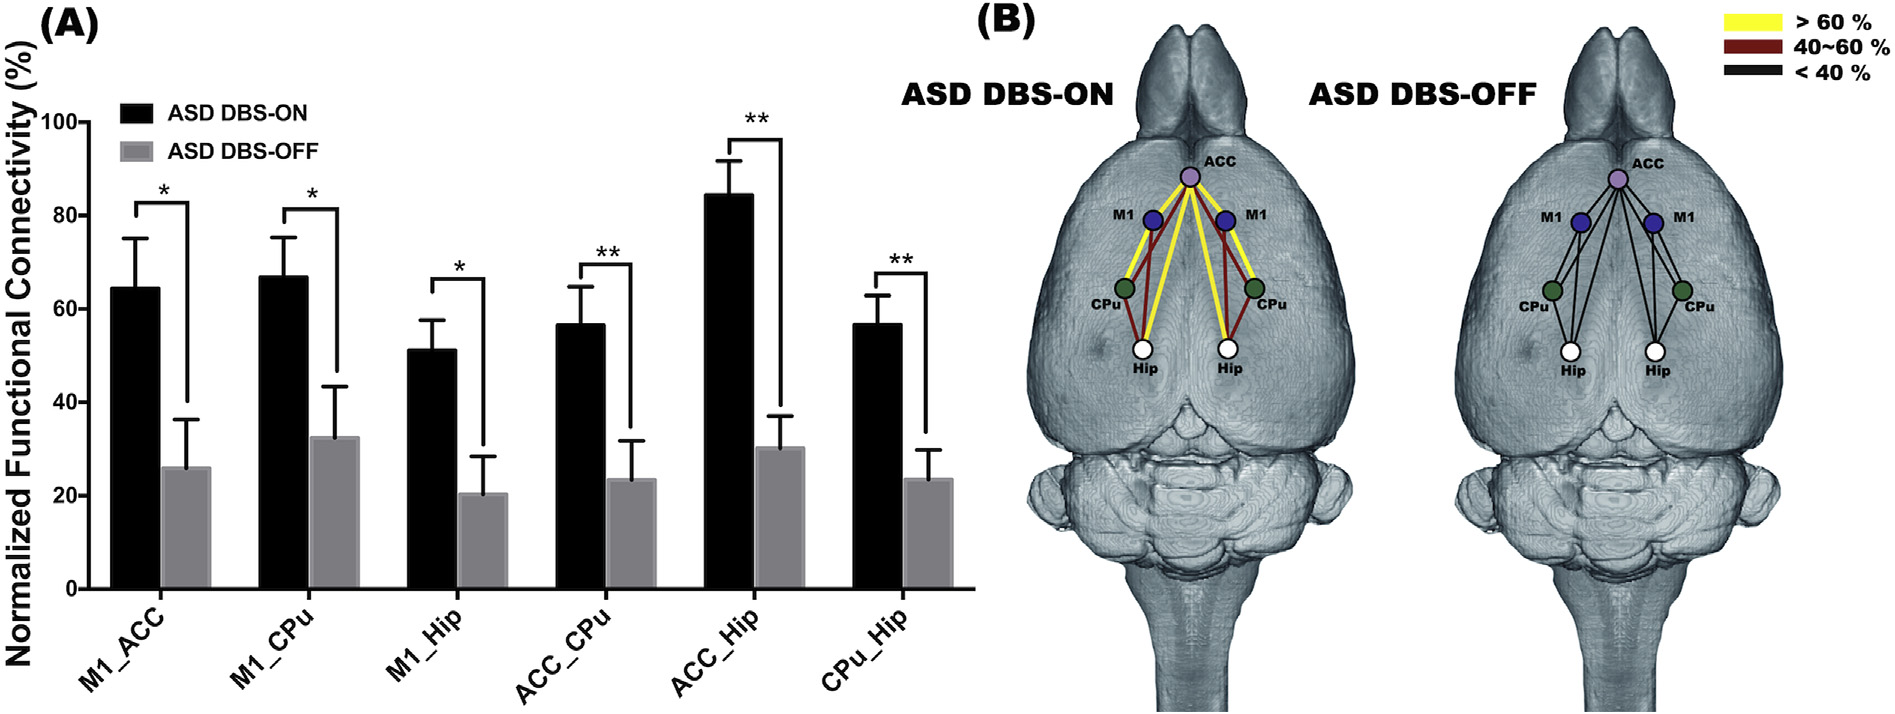
Fig4. FC alteration after CT-DBS in ASD model.